Technology Marketing Campaigns: A Manifesto for the Modern Marketer
If technology is the engine of innovation, consider technology marketing campaigns the grease that turns the wheels. It’s like the game of chess:...
%20(1)-3.png)
I was always told that my background in psychology would be helpful for a career in marketing. At first, it seemed apparent - studying people’s behavior allows you to understand how to sell products and services to them. However, I soon discovered that my psychology degree prepared me for marketing in another way.
Because I excelled at statistics, research methods, and academic writing, I could apply these skills to gain a competitive edge in marketing analytics.
According to the Harvard Business School, marketing analytics involves tracking and analyzing data from all types of marketing activities to reach a quantitative goal. When an agency or internal marketing department is dealing with search engine optimization, social media, or digital advertising, it’s crucial to get comfortable with the underlying data.
This post aims to walk through the process of creating a data study for marketing, analyzing the results, and applying the findings to enhance a company’s marketing strategy.
This is something I learned from studying psychology. Always go back to the scientific method.
One of the biggest problems I see with marketing analytics departments is a lack of clear objectives. Before beginning a data study, the business needs to define the problem or objective. Without this starting point, a marketing analytics project becomes a fishing expedition.
To demonstrate, let’s walk through a data project we put together for Hire A Writer.
Approximately 95% of the organic traffic to hireawriter.us is driven by branded queries (shown below).
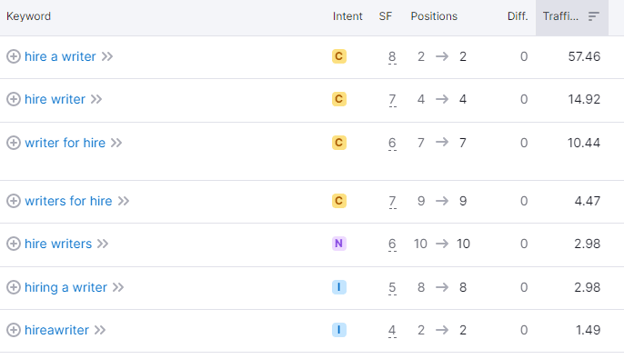
Therefore, our starting question for the project was, “How can we drive more non-branded traffic to the HAW site?”
To start, we gathered data from Google Search Console for non-branded queries driving traffic to the HAW site over the past 6 months. Looking at the data for clicks, impressions, CTR, and average position specifically for non-branded queries, we can uncover trends.
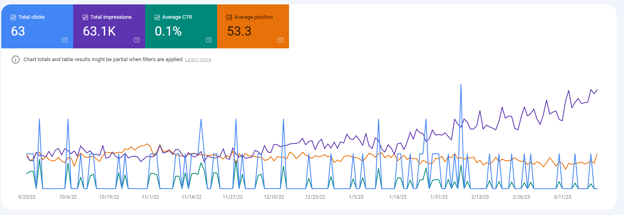
For example, the impressions seemed to increase significantly starting around December 5, 2022, while CTR and average position have been relatively stable over time.
That being said, we need to take a deeper dive into which queries are performing the best, so we generated a quick list below:
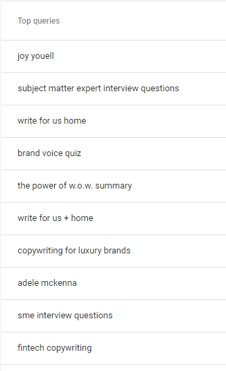
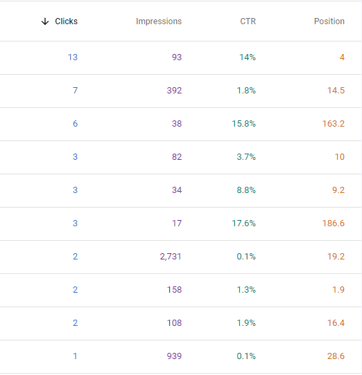
While it’s easy to assume that the queries with the most clicks are the best to focus on, we also want to look at the impressions, which can be a measure of search behavior, and position, to understand where the HAW pages currently stand.
For the next stages of the analysis, we’ll need to export all of the relevant data to clean and visualize.
Even when you’re collecting data from GSC, it’s going to be messy. From spelling errors to spacing issues, text data isn’t easy to work with. Therefore, we cleaned our data and used RegEx to extract any branded keywords from our list.
As a data scientist, I feel most comfortable doing my data cleaning with Python, but you can also use Microsoft Excel, R programming, Google Sheets, or other methods that are familiar to you.
Now, this might be a little technical, but here’s the code I used to get my non-branded queries:
variable='hire'
df['branded']=np.where(df['queries'].str.contains(variable, regex=True, case=False), 1, 0)
dfnonbranded=df[df['branded']==0]
Once I had my new dataset ready, I began my exploratory data analysis.
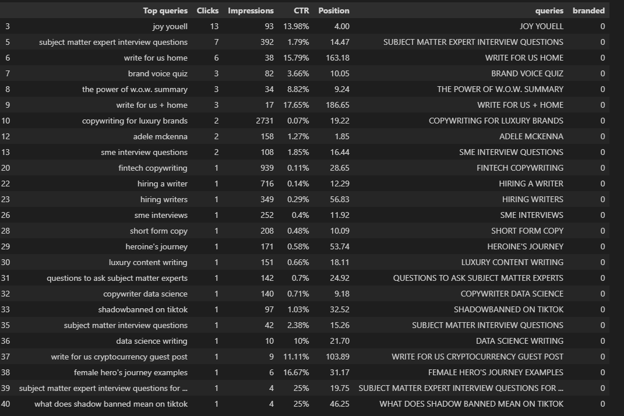
In my Jupyter Notebook, I sorted the clean non-branded search data by clicks, by impressions, and by position to see how my top 10 lists differ.


Something that you might notice is that there’s a balance between how much to prioritize clicks, impressions, and position. Basically, we can’t just look at the three separate lists because they will tell us something completely different. Instead, the goal of my analysis is to rank the keywords according to a combination of these factors.
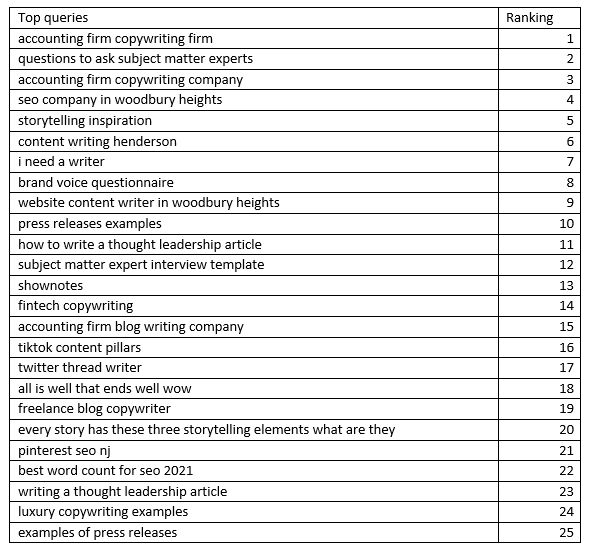
As a demonstration, we did a quick multi-criteria ranking model to get a list of 25 potentially useful keywords to focus on.
It required some coding, but I was able to take the nonbranded queries that are currently ranking in the top 40 positions and rank them based on a combination of clicks, impressions, and position, yielding this list of 25 keywords to prioritize:
Now that we found a list of nonbranded keywords to focus on, what’s next? In general, a company will want to create small tasks to accomplish in a reasonable time frame. Allow 30 days to test and analyze those results and then reevaluate.
In this example, we would ideally layer additional data on our analysis. For instance, we’d want to look at the search volume and Google Trends data for each of the words in our list. Additionally, it would be helpful to look at which landing pages are ranking for each term on the list and go through each page to optimize.
Some of the key factors to consider include:
Of course, there are plenty of other factors to consider when optimizing web pages for SEO, but by starting with a few of the basic points, SEO analysts can get an idea of the greatest opportunities for improvement.
When designing a marketing analytics project, it’s important to account for iterations of improvement. By continuously tracking your progress, you can monitor changes and pick up on any positive and negative impacts quickly.
At Hire a Writer, we specialize in search engine optimization (SEO). Not only do we tackle content writing, but we also handle SEO analytics. Contact us today to learn more about working with Hire a Writer.
%20(1).png)
If technology is the engine of innovation, consider technology marketing campaigns the grease that turns the wheels. It’s like the game of chess:...
%20(1)-1.png)
By day, I’m a data scientist. I spend most of my time looking at tables, graphs, and numbers; running statistical analyses; and solving business...
-1.png)
Marketing for tech-oriented industries requires a unique set of skills and strategies. Technology marketing companies play a crucial role in bridging...